Go常用的性能分析工具:
pprof: On-Cpu Profile Memory GoRoutine
fgprof: On-Cpu/Off-Cpu
trace: For trace RunTime bugs
perf: when no pprof
pprof
支持什么使用模式
- Report generation:报告生成
- Interactive terminal use:交互式终端使用
- Web interface:Web 界面
可以做什么
- CPU Profiling:CPU 分析,按照一定的频率采集所监听的应用程序 CPU(含寄存器)的使用情况,可确定应用程序在主动消耗 CPU 周期时花费时间的位置
- Memory Profiling:内存分析,在应用程序进行堆分配时记录堆栈跟踪,用于监视当前和历史内存使用情况,以及检查内存泄漏
- Block Profiling:阻塞分析,记录 goroutine 阻塞等待同步(包括定时器通道)的位置
- Mutex Profiling:互斥锁分析,报告互斥锁的竞争情况
举一个broccoli里面的pprof的监控例子:
1
2
3
4
5
6
7
8
9
10
11
12
13
14
15
16
17
18
19
20
21
22
23
var (
	_perfOnce sync.Once
)

// 启动监听pprof
func StartPerf(pprofc config.PProf) {
	_perfOnce.Do(func() {
		mux := http.NewServeMux()
		mux.HandleFunc("/debug/pprof/", pprof.Index)
		mux.HandleFunc("/debug/pprof/cmdline", pprof.Cmdline)
		mux.HandleFunc("/debug/pprof/profile", pprof.Profile)
		mux.HandleFunc("/debug/pprof/symbol", pprof.Symbol)

		go func() {
			if pprofc.HostURI == "" {
				panic(errors.Errorf("pprof: http perf must be set tcp://$host:port ", pprofc.HostURI))
			}
			if err := http.ListenAndServe(pprofc.HostURI, mux); err != nil {
				panic(errors.Errorf("pprof: listen %s: error(%v)", pprofc.HostURI, err))
			}
		}()
	})
}
详细的框架实现可以点击了解broccoli框架
服务起来之后,就会多多一条路由,如http://127.0.0.1:8000/debug/pprof,有以下输出
1
2
3
4
5
6
7
8
9
/debug/pprof/

profiles:
0    block
62    goroutine
444    heap
30    threadcreate

full goroutine stack dump
这个路径下还有几个子页面:
/debug/pprof/profile:访问这个链接会自动进行 CPU profiling,持续 30s,并生成一个文件供下载/debug/pprof/heap: Memory Profiling 的路径,访问这个链接会得到一个内存 Profiling 结果的文件/debug/pprof/block:block Profiling 的路径/debug/pprof/goroutines:运行的 goroutines 列表,以及调用关系
还可以生成关系拓扑图:
1
2
go tool pprof helloworld demoprof.prof
(pprof) web  #生成调用关系图,demo.svg文件
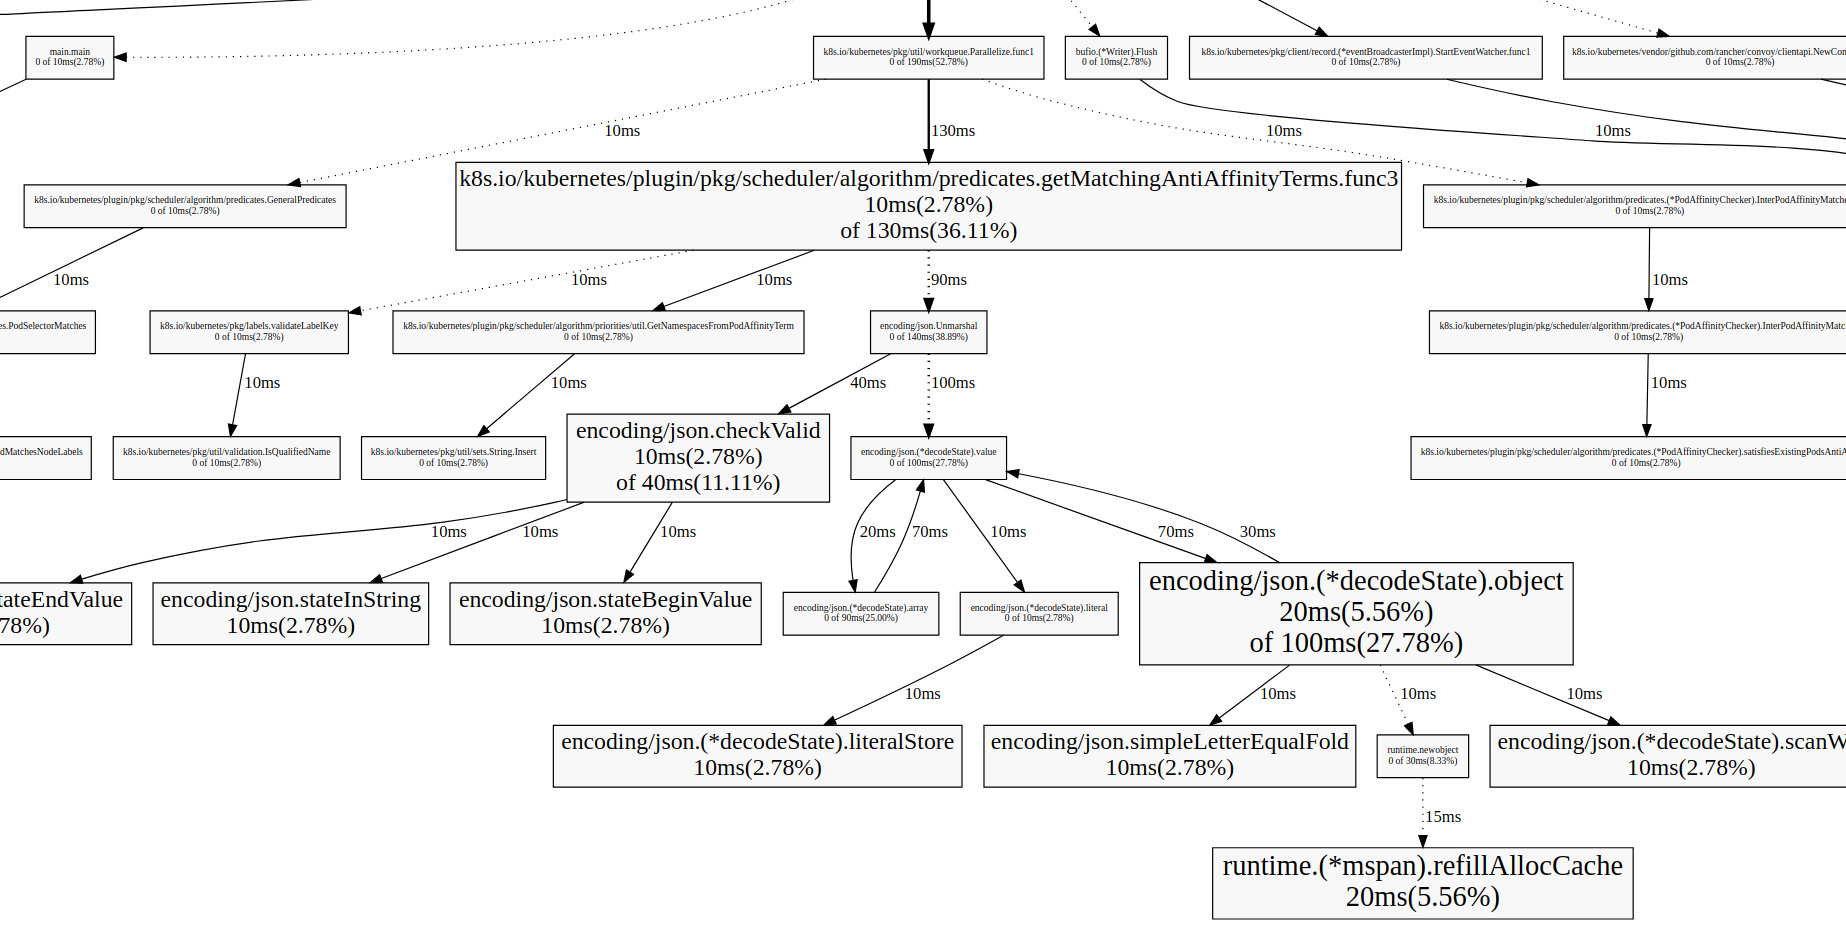
每个方框代表一个函数,方框的大小和执行时间成正比,箭头代表调用关系,箭头上的时间代表被调用函数的执行时间
从上图可以看出很多分析点:
如: 从上图可以看出json转码效率并没那么高,通信可以采取更便捷的二进制文件,例如:proto
生成火焰图:
- 先下载
[go-torch](https://github.com/uber/go-torch)工具 - 生成 火焰图
1
go-torch  -u url( 选择是 CPU 或是 memory 等的 profile 文件 )
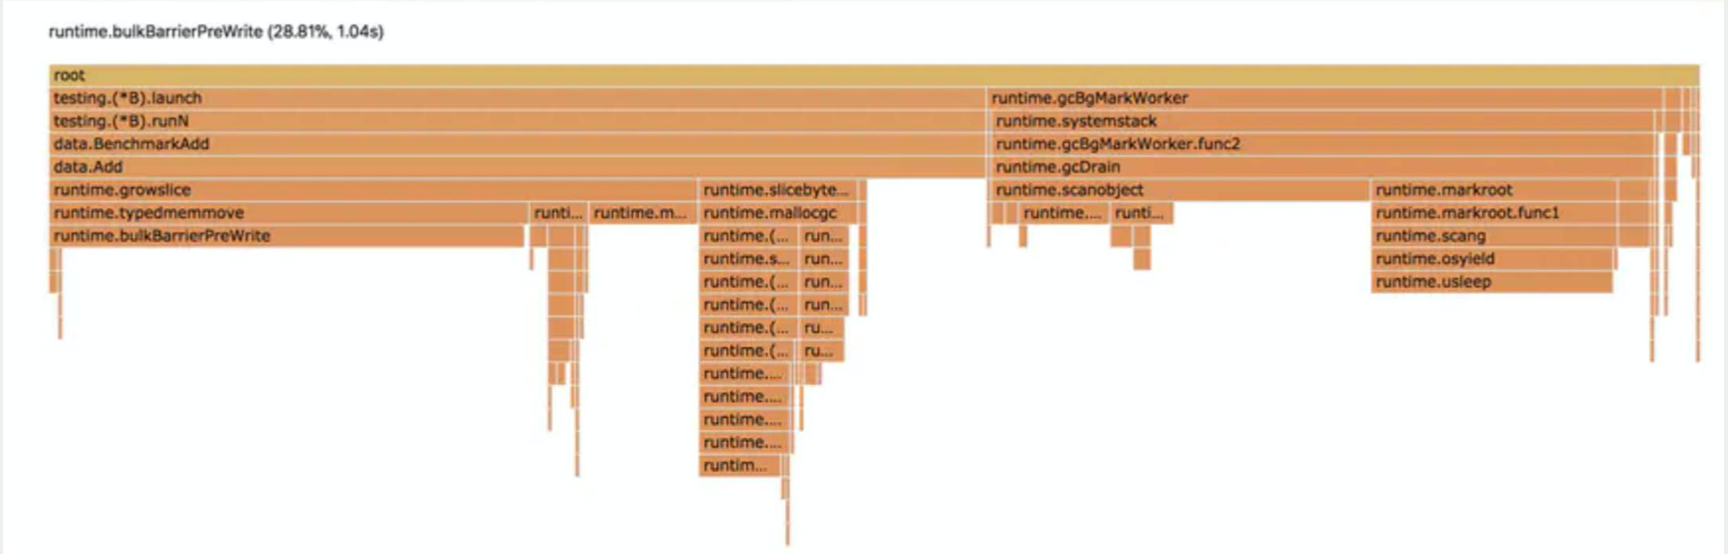
可以看到这个cpu-profile分析东西
如:runtime.bulkBarrierPreWrite 这个是gc的读写屏障,一般超过20%已经算高的了,现在是28.81%,所以看出gc的cpu调用过高,进一步分析可能出现指针逃逸等导致heap分配过大导致gc调用过多等
fgprof
fgprof is implemented as a background goroutine that wakes up 99 times per second and calls runtime.GoroutineProfile. This returns a list of all goroutines regardless of their current On/Off CPU scheduling status and their call stacks.
-
On-CPU: 线程花费在CPU上的时间。
-
Off-CPU: 线程阻塞在I/O、锁、计时器、页交换等场景中的等待时间。
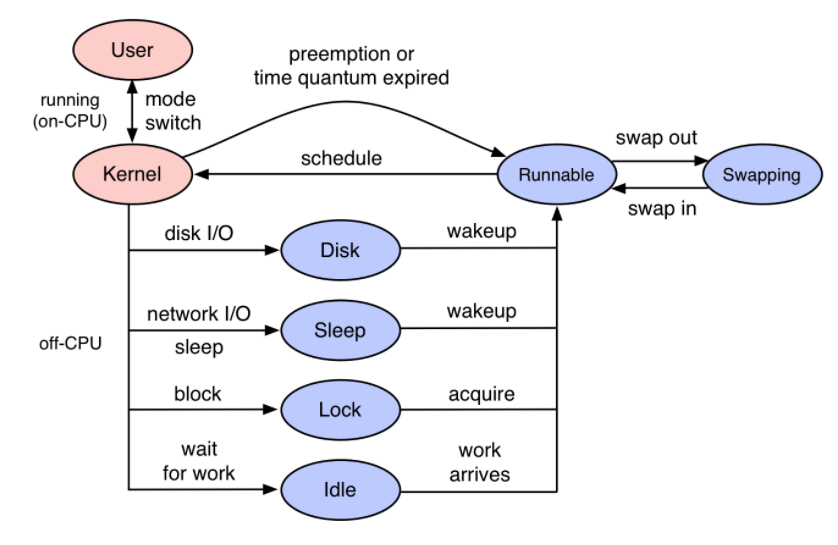
从上图可以知道,当遇到线程block,或者network的IO阻塞,单靠pprof对于On-Cpu的分析是没办法从火焰图上得到Off-Cpu的阻塞性能分析的
举个例子:
假如给你一个任务,要你优化下面的代码。这是一个简单的程序,在一个循环中调用三个函数。
1
2
3
4
5
6
7
8
9
10
func main() {
	for {
		// http调用函数,可能比较慢
		slowNetworkRequest()
		// 很重的CPU计算
		cpuIntensiveTask()
		// 未知的函数,不知道它执行的快慢
		weirdFunction()
	}
}
一种方式就是包装一个函数,以便计算它们的时间消耗:
1
2
3
4
start := time.Start()
slowNetworkRequest()
fmt.Printf("slowNetworkRequest: %s\n", time.Since(start))
// ...
但是这样做太糟糕了,你需要在每个函数前后都加上统计时间的代码。如果你使用/debug/pprof/profile进行分析的话, 可以修改代码:
1
2
3
4
5
6
7
8
9
import _ "net/http/pprof"

func main() {
	go func() {
		log.Println(http.ListenAndServe(":6060", nil))
	}()

	// <code to profile>
}
然后使用pprof进行分析go tool pprof -http=:6061 http://localhost:6060/debug/pprof/profile?seconds=10:
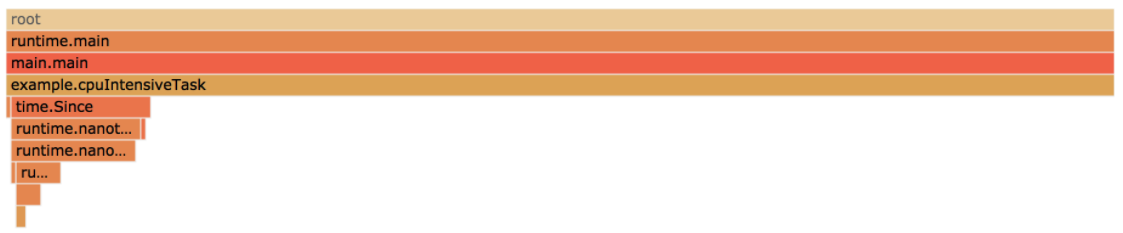
看起来是cpuIntensiveTask占比最高。但是查看我们的日志,根据日志中打印出来的每个函数调用的耗时:
1
2
3
4
5
6
7
slowNetworkRequest: 66.815041ms
cpuIntensiveTask: 30.000672ms
weirdFunction: 10.64764ms
slowNetworkRequest: 67.194516ms
cpuIntensiveTask: 30.000912ms
weirdFunction: 10.105371ms
// ...
实际上是slowNetworkRequest耗时最久,但是上面的火焰图却没反应出来,这个火焰图只显示了那个函数占用CPU的时间最多,也就是On-CPU的性能分析。
那么如何都显示Off-Cpu负载的情况呢,可以使用fgprof,你可以在http中配置一个handler:
1
2
3
4
5
6
7
8
9
10
11
12
13
import(
	_ "net/http/pprof"
	"github.com/felixge/fgprof"
)

func main() {
	http.DefaultServeMux.Handle("/debug/fgprof", fgprof.Handler())
	go func() {
		log.Println(http.ListenAndServe(":6060", nil))
	}()

	// <code to profile>
}
然后执行go tool pprof --http=:6061 http://localhost:6060/debug/fgprof?seconds=10,最终mian这三个函数正常的显示了,而且正确显示花在它们上面的时间。

从上图可以看出slowNetworkfRequest耗时事最高的,整个程序是卡在了network的IO上,所以可以进一步对于NetWork的IO进行优化。
你可以把它配置在你自己的web框架中,但博主封装的Broccoli框架并没有这样做,那是为什么呢?
因为fgprof 是启动了一个后台的 goroutine,每秒启动 99 次,调用 runtime.GoroutineProfile 来采集所有 gorooutine 的栈。
虽然看起来很美好:
1
2
3
4
5
6
7
8
9
10
11
12
13
14
15
16
17
18
19
20
21
22
23
24
25
26
27
28
29
func GoroutineProfile(p []StackRecord) (n int, ok bool) {
    .....
	stopTheWorld("profile")

	for _, gp1 := range allgs {
		......
	}

	if n <= len(p) {
		// Save current goroutine.
		........
		systemstack(func() {
			saveg(pc, sp, gp, &r[0])
		})

		// Save other goroutines.
		for _, gp1 := range allgs {
			if isOK(gp1) {
				.......
				saveg(^uintptr(0), ^uintptr(0), gp1, &r[0])
                .......
			}
		}
	}

	startTheWorld()

	return n, ok
}
但调用 GoroutineProfile 函数的开销并不低,如果线上Broccoli框架封装的认证系统或者中台系统的 goroutine经常上万,每次采集 profile 都遍历上万个 goroutine 的成本实在是太高了。所以 fgprof 一般只在线下排查问题单独使用,下一篇将讲博主怎么使用fgprof排查现实问题的。
trace
一般情况下我们是不需要使用 trace 来定位性能问题的,通过压测 + profile 就可以解决大部分问题,除非我们的问题与 runtime 本身的问题相关。
比如 STW 时间比预想中长,超过百毫秒,向官方反馈问题时,才需要出具相关的 trace 文件。比如类似 long stw 这样的 issue。
后面会单独发一篇关于gc和golang内存分配上的文章会根据trace导出其stw等的操作耗时等更加内核追踪性能。上面会详细使用到trace。
今天的学习分享到此结束,欢迎交流呀~