Prometheus Install
引言
Prometheus 是一个开源的监控解决方案,是一套开源的系统监控和报警框架,它能够提供监控指标数据的采集、存储、查询以及监控告警等功能。作为云原生基金会(CNCF)的毕业项目,Prometheus 已经在云原生领域得到了大范围的应用,并逐渐成为了业界最流行的监控解决方案之一。
安装部署Prometheus
Linux安装Prometheus
-
下载Prometheus二进制文件
1
$ wget https://github.com/prometheus/prometheus/releases/download/v2.22.0/prometheus-2.22.0.linux-amd64.tar.gz
-
解压文件到相关目录,安装promtool
1
2
3
$ tar -xzf prometheus-2.14.0.linux-amd64.tar.gz
$ sudo cp prometheus-2.14.0.linux-amd64/prometheus /usr/local/bin/
$ sudo cp prometheus-2.14.0.linux-amd64/promtool /usr/local/bin/
-
执行prometheus –version 查看版本验证安装
Windows安装Prometheus
- 官网下载压缩包prometheus-2.22.0-rc.0.windows-amd64.tar.gz
- 解压到指定文件夹运行exe即可
配置Prometheus
Prometheus通过YAML文件来配置。Prometheus的解压的目录中自带有配置文件
./prometheus.yml
global:
  scrape_interval:     15s # 应用程序或服务抓取数据的时间间隔,默认为1min
  evaluation_interval: 15s # Prometheus评估规则(记录规则、警报规则)的频率,默认为1min
  # scrape_timeout is set to the global default (10s).

# Alertmanager configuration 设置Prometheus的警报。Prometheus支持Alertmanager服务发现功能。
alerting:
  alertmanagers:
  - static_configs:
    - targets:
      # - alertmanager:9093

# 一次性加载规则,并且每隔evaluation_interval时间对规则进行评估'evaluation_interval'.
# 指定包含记录规则或警报规则的文件列表。
rule_files:
  # - "first_rules.yml"
  # - "second_rules.yml"

# 指定Prometheus抓取的所有目标
# 下面是监控Prometheus本身
# 包含指定Prometheus抓取的所有目标。
scrape_configs:
  # job名字将会被加到监控的指标中`job=<job_name>`
  - job_name: 'prometheus'

    # metrics_path 默认为 '/metrics'
    # scheme 默认为 'http'.

    static_configs:
    - targets: ['localhost:9090']
运行Prometheus
-
将配置文件prometheus.yml移到合适的位置
1
2
$ sudo mkdir -p /etc/prometheus
$ sudo cp prometheus.yml /etc/prometheus/
-
运行prometheus应用
1
$ prometheus --config.file "/etc/prometheus/prometheus.yml"
-
如果发生异常,可以使用promtool来验证配置文件
1
2
3
$ promtool check config prometheus.yml
Checking prometheus.yml
    SUCCESS: 0 rule files found
Prometheus监控数据源
从下图架构可知,PrometheusServer的数据主要来自两个方面,Pushgateway与Jobs/Exporters。
Prometheus架构
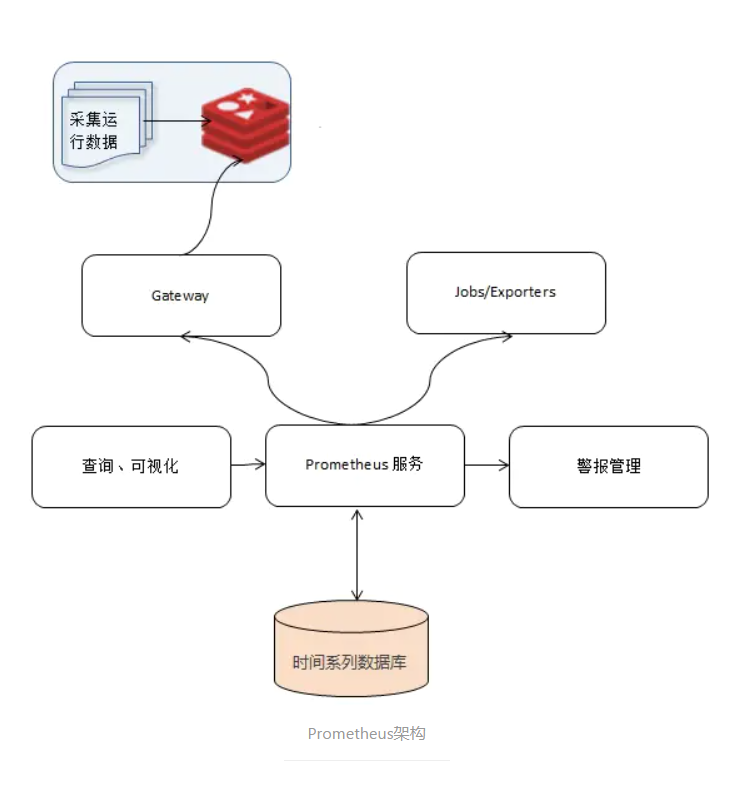
Pull方式:
Jobs/Exporters
-
Promethes上添加自定义端口的 Job(./prometheus.yml)
1
2
3
4
5
6
7
8
9
10
11
12
13
14
15
16
17
18
19
20
21
22
23
24
25
26
27
28
29
30
31
32
33
34
35
# my global config
global:
  scrape_interval:     15s # Set the scrape interval to every 15 seconds. Default is every 1 minute.
  evaluation_interval: 15s # Evaluate rules every 15 seconds. The default is every 1 minute.
  # scrape_timeout is set to the global default (10s).

# Alertmanager configuration
alerting:
  alertmanagers:
  - static_configs:
    - targets:
      # - alertmanager:9093

# Load rules once and periodically evaluate them according to the global 'evaluation_interval'.
rule_files:
  # - "first_rules.yml"
  # - "second_rules.yml"

# A scrape configuration containing exactly one endpoint to scrape:
# Here it's Prometheus itself.
scrape_configs:
  # The job name is added as a label `job=<job_name>` to any timeseries scraped from this config.
  - job_name: 'prometheus'

    # metrics_path defaults to '/metrics'
    # scheme defaults to 'http'.

    static_configs:
    - targets: ['localhost:9090']

  - job_name: 'applyexporter'
    static_configs:
      - targets: ['localhost:8085']
        labels:
          instance: apply-exporter
-
Demo_Prometheus/client_golang例子
1
2
3
4
5
6
7
8
9
10
11
12
13
14
15
16
//构造HistogramVec
	httpServerTimer :=prometheus.NewHistogramVec(prometheus.HistogramOpts{
		Name: "zeus_http_server_duration",
		Help: "zeus_http_server_duration",
	}, []string{"trace_id", "url"})
	//注册timer
	prometheus.MustRegister(httpServerTimer)
	//测试timer
	t := time.Now()
	time.Sleep(time.Second*5)
	httpServerTimer.WithLabelValues([]string{"tid_1234", "http://localhost:8085/httpserver/timer/test"}...).Observe(float64(time.Since(t)/time.Millisecond))
	//创建端口等待Pull
	http.HandleFunc("/metrics", func(w http.ResponseWriter, r *http.Request) {
		h := promhttp.Handler()
		h.ServeHTTP(w, r)
	})
Pushgateway
注:Prometheus主要是基于拉取的架构来运行作业,这种方式主要应用于网络隔离环境
-
安装Pushgateway
1
2
3
$ wget https://github.com/prometheus/pushgateway/releases/download/v1.0.0/pushgateway-1.0.0.linux-amd64.tar.gz
$ tar -xzf pushgateway-1.0.0.linux-amd64.tar.gz
$ sudo cp pushgateway-1.0.0.linux-amd64/pushgateway /usr/local/bin
-
配置和运行Pushgateway
1
$ pushgateway --web.listen-address="0.0.0.0:9091" --persistence.file="/tmp/pushgateway_persist" --persistence.interval=5m
–web.listen-address:指定服务端口。pushgateway默认端口是9091
–persistence.file:指标持久化到路径。默认情况下,pushgateway所有指标存储在内存中,如果 pushgateway停止服务或者重新启动,所有数据将会丢失。
–persistence.interval:指标持久化写入周期。默认5m
-
Promethes上添加Pushgateway Job(./prometheus.yml)
1
2
3
4
5
6
7
8
9
10
11
12
13
14
15
16
17
18
19
20
21
22
23
24
25
26
27
28
29
30
31
32
33
34
35
36
# my global config
global:
  scrape_interval:     15s # Set the scrape interval to every 15 seconds. Default is every 1 minute.
  evaluation_interval: 15s # Evaluate rules every 15 seconds. The default is every 1 minute.
  # scrape_timeout is set to the global default (10s).

# Alertmanager configuration
alerting:
  alertmanagers:
  - static_configs:
    - targets:
      # - alertmanager:9093

# Load rules once and periodically evaluate them according to the global 'evaluation_interval'.
rule_files:
  # - "first_rules.yml"
  # - "second_rules.yml"

# A scrape configuration containing exactly one endpoint to scrape:
# Here it's Prometheus itself.
scrape_configs:
  # The job name is added as a label `job=<job_name>` to any timeseries scraped from this config.
  - job_name: 'prometheus'

    # metrics_path defaults to '/metrics'
    # scheme defaults to 'http'.

    static_configs:
    - targets: ['localhost:9090']

  - job_name: 'pushgateway'
    honor_labels: true
    static_configs:
      - targets: ['localhost:9091']
        labels:
          instance: pushgateway
-
Demo_Prometheus/client_golang例子
1
2
3
4
5
6
//记录应用作为HttpServer的错误码数量统计
push.New("http://localhost:9091/", "error_code_coll").Collector(prometheus.NewCounterVec(
		prometheus.CounterOpts{
			Name: "zeus_http_server_error_code",
			Help: "zeus_http_server_error_code",
		}, []string{"trace_id", "url", "err_code"})).Add()
以上为此章Prometheus-Install的内容,进一步应用实例与自带的Exporter和Alert Manager报警处理等更多应用方面的内容
请查看下一章链接:
Prometheus-Apply: