EFK技术选型
Elasticsearch 分布式搜索引擎,对于Filebeat收集的数据进行存储。对于多机日志ES相当于一个漏斗,通过es语句的搜素快速定位故障,提高诊断效率。
Filebeat 轻量级数据收集引擎,相对于传统的ELK,Logstash比较大,一般用他来做日志的分析格式化(二次处理),所以轻量级日志收集使用Firebeat,Friebeat 用go写的,对环境不依赖可以直接运行,而且很轻量大概 3M 多,这对部署实施时很有利。
Kibana 可视化化平台,用来做日志查看分析。可以通过从es里搜索出来的数据做可视化展示,Dashboard数据监控面板。能制作出日常图标,对数据分析十分有利。
ES部署及配置
安装elasticsearch和jre
rpm -ivh elasticsearch-6.4.1.rpm jre-8u181-linux-x64.rpm
安装ingest-csv插件
elasticsearch-plugin install file:///path/to/ ingest-csv-6.4.1.0.zip
配置ES,修改 /etc/elasticsearch/elasticsearch.yml
path.data: /var/lib/elasticsearch
path.logs: /var/log/elasticsearch
http.port: 9200
cluster.name: log-efk //加入的集群名称
node.name: tif-1-192.168.0.1 //节点名称
network.host: 192.168.0.1 //节点路径
discovery.zen.ping.unicast.hosts: [“192.168.0.1”]
bootstrap.system_call_filter: false「因为Centos6不支持SecComp」”详情“
bootstrap.memory_lock: true「防止es内存被swap」*
node.master: true
node.data: true
node.ingest: true
thread_pool.bulk.queue_size: 1000
/etc/elasticsearch/jvm.options 中,将jvm内存大小配置为系统内存一半大小
-Xms1g => -Xms32g
-Xmx1g => -Xmx32g
系统配置:/etc/security/limit.conf 中增加如下两行配置
elasticsearch - nproc 65535
elasticsearch - nofile 655350
Filebeat部署及配置
在需要采集日志的机器上部署 filebeat 服务。
tar xvfz filebeat-6.4.1-linux-x86_64.tar.gz
修改filebeat.yml如下:
filebeat.inputs:
- type: log
enabled: true
paths:
- /data/solution/smartgate/log/.access.csv //日志文件的路径
filebeat.config.modules:
path: ${path.config}/modules.d/*.yml
reload.enabled: false
setup.template.settings:
index.number_of_shards: 3
setup.kibana:
output.elasticsearch:
hosts: [“192.168.200.129:9200”] //elasticsearch监听地址
pipeline: splog-access-authgate //在kibana中定义的pipeline的名字
worker: 2
bulk_max_size: 256
- /data/solution/smartgate/log/.access.csv //日志文件的路径
另一个多pipeline的配置:
filebeat.prospectors:
- type: log
paths: - /authgatelogs/.access.csv
fields:
type: smartgate.access - type: log
paths: - /apigatelogs/.access.csv
fields:
type: apigate.access
processors: - add_cloud_metadata:
setup.template.enabled: false
output.elasticsearch:
hosts: [“http://elasticsearch:9200/”]
pipelines: - pipeline: splog-access-authgate
when.equals:
fields.type: smartgate.access - pipeline: splog-access-apigate
when.equals:
fields.type: apigate.access
worker: 2
bulk_max_size: 256
启动filebea进程: nohup ./filebeat -e -c filebeat.yml &
Kinbana部署及配置
安装kinbana
Rpm -ivh kibana-6.4.1-x86_64.rpm
编辑/etc/kibana/kibana.yml配置文件
server.port: 5601 //监听端口
server.host: “192.168.0.1” //监听地址
elasticsearch.url: http://192.168.0.1:9200 //elasticsearch的监听地址
管理和启动kinbana服务
systemctl enable kinbana
systemctl start kinbana
打开http://192.168.0.1:5601
#在Dev Tools中增加pipeline,pipeline跟filebeat中设置的pipeline保持一致。
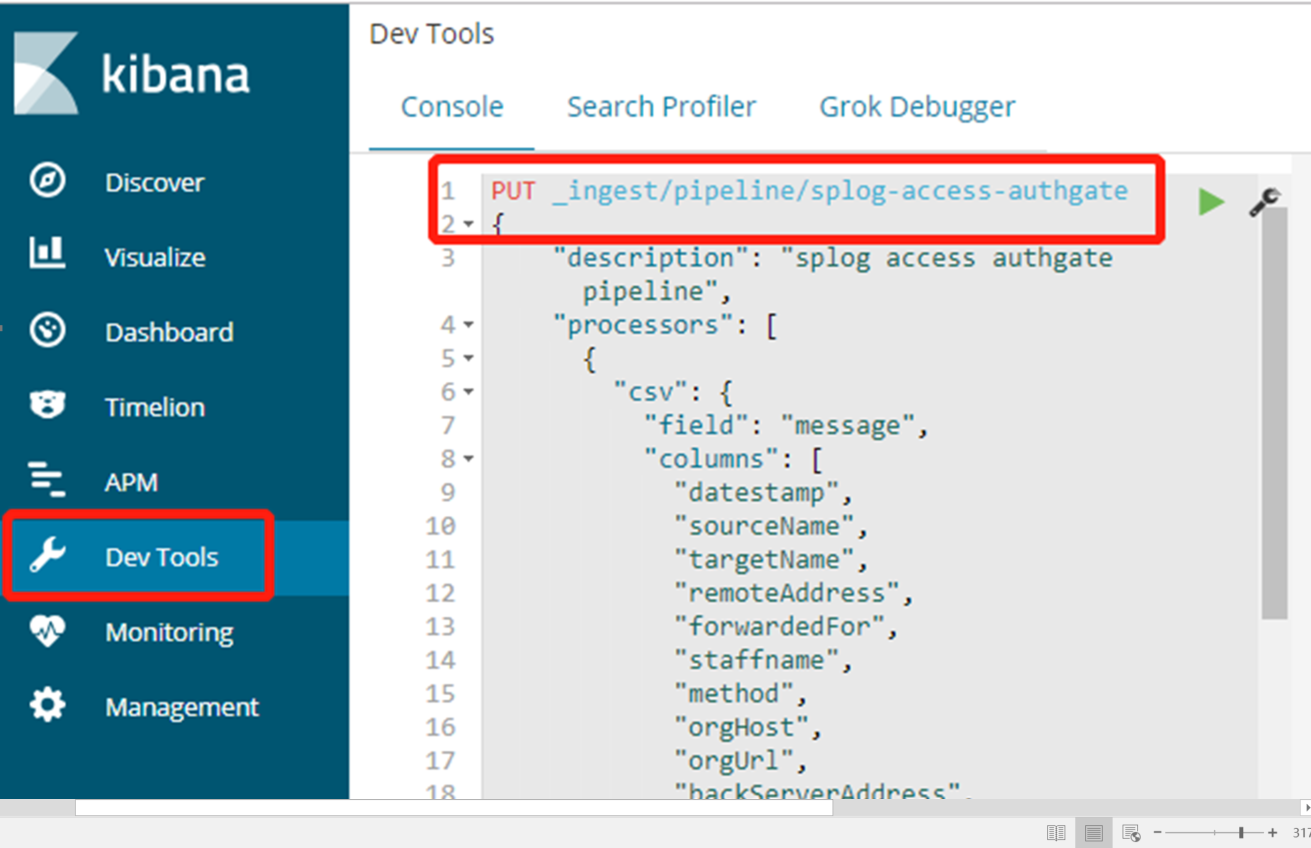
PUT _ingest/pipeline/splog-access-authgate
        {
    "description": "splog access authgate pipeline",
    "processors": [
      {
        "csv": {
        field": "message",
          "columns": [
            "datestamp",
            "sourceName",
            "targetName",
            "remoteAddress",
            "forwardedFor",
            "staffname",
            "method",
            "orgHost",
            "orgUrl",
            "backServerAddress",
            "port",
            "path",
            "methodName",
            "duration",
            "reqLength",
            "resLength",
            "userAgent",
            "xRioSeq",
            "targetXRioSeq",
            "host",
            "referer",
            "serverIp",
            "statusCode",
            "errorInfo",
            "authorization",
            "device_id",
            "device_ticket"
          ],
          "ignore_failure": false
        }
      },
      {
        "grok": {
          "field": "forwardedFor",
          "patterns": [
            "%{TOKEN:directRemoteAddress}"
          ],
          "pattern_definitions": {
            "TOKEN": "[.0-9]+$"
          },
          "ignore_failure": true
        }
      },
      {
        "grok": {
          "field": "referer",
          "patterns": [
            "[?&]page=%{TOKEN:page}"
          ],
          "pattern_definitions": {
            "TOKEN": "[a-zA-Z/.0-9_\\-]+$"
          },
          "ignore_failure": true
        }
      },
      {
        "grok": {
          "field": "referer",
          "patterns": [
            "[?&]citycode=%{TOKEN:citycode}"
          ],
          "pattern_definitions": {
            "TOKEN": "[a-zA-Z/.0-9_\\-]+$"
          },
          "ignore_failure": true
        }
      },
      {
        "gsub": {
          "field": "forwardedFor",
          "pattern": ",",
          "replacement": ", "
        }
      },
      {
        "gsub": {
          "field": "backServerAddress",
          "pattern": ",",
          "replacement": ", "
        }
      },
      {
        "grok": {
          "field": "orgUrl",
          "patterns": [
            "%{TOKEN:orgPathName}"
          ],
          "pattern_definitions": {
            "TOKEN": "[^?]+"
          },
          "ignore_failure": true
        }
      },
      {
        "grok": {
          "field": "backServerAddress",
          "patterns": [
            "%{TOKEN:directBackServer}"
          ],
          "pattern_definitions": {
            "TOKEN": "[.0-9]+$"
          },
          "ignore_failure": true
        }
      },
      {
        "grok": {
          "field": "datestamp",
          "patterns": [
            "%{TOKEN:second}"
          ],
          "pattern_definitions": {
            "TOKEN": "[^.]+"
          },
          "ignore_failure": true
        }
      },
      {
        "date": {
          "field": "datestamp",
          "target_field": "@timestamp",
          "formats": [
            "yyyy-MM-dd HH:mm:ss.SSS",
            "ISO8601"
          ],
          "timezone": "Asia/Shanghai",
          "ignore_failure": true
        }
      },
      {
        "date_index_name": {
          "field": "@timestamp",
          "index_name_prefix": "splog-access-authgate-",
          "index_name_format": "yyyy.MM.dd",
          "date_rounding": "d",
          "timezone": "Asia/Shanghai",
          "ignore_failure": true
        }
      },
      {
        "gsub": {
          "field": "source",
          "pattern": "^.*/",
          "replacement": ""
        }
      },
      {
        "remove": {
          "field": "datestamp"
        }
      },
      {
        "remove": {
          "field": "beat.hostname"
        }
      },
      {
        "remove": {
          "field": "beat.version"
        }
      },
      {
        "remove": {
          "field": "message"
        }
      }
    ],
    "on_failure": [
      {
        "set": {
          "field": "parse_err_message",
          "value": ""
        }
      },
      {
        "set": {
          "field": "_index",
          "value": "splog-parse-failed"
        }
      }
    ]
  }
#在Dev Tools中增加template:
PUT _template/splog-access
{
    "order": 0,
    "version": 1,
    "index_patterns": [
      "splog-access-*",
      "xtbg-splog-access-*",
      "splog-req-*"
    ],
    "settings": {
      "index": {
        "refresh_interval": "30s",
        "number_of_shards": "6",
        "translog": {
          "sync_interval": "5s",
          "durability": "async"
        },
        "number_of_replicas": "0"
      }
    },
    "mappings": {
      "doc": {
        "dynamic_templates": [
          {
            "fields": {
              "path_match": "fields.*",
              "mapping": {
                "type": "keyword"
              },
              "match_mapping_type": "string"
            }
          },
          {
            "strings_as_keyword": {
              "mapping": {
                "ignore_above": 4096,
                "type": "keyword"
              },
              "match_mapping_type": "string"
            }
          }
        ],
        "properties": {
          "duration": {
            "type": "long"
          },
          "@timestamp": {
            "type": "date"
          },
          "forwardedFor": {
            "type": "text"
          },
          "backServerAddress": {
            "type": "text"
          },
          "reqLength": {
            "type": "long"
          },
          "@version": {
            "type": "keyword"
          },
          "errorInfo": {
            "type": "text"
          },
          "resLength": {
            "type": "long"
          },
          "userAgent": {
            "type": "text"
          }
        }
      }
    },
    "aliases": {}
  }
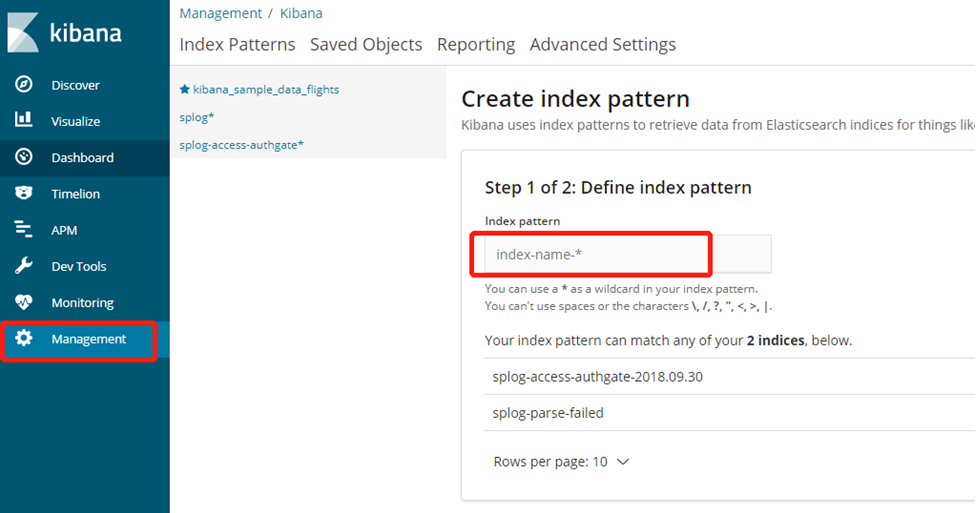
在Management-Kibana-Index Patterns中加入Index Pattern,即可在Discover中看到日志数据。